PATRICK INDUSTRIES (PATK)·Q4 2025 Earnings Summary
Patrick Industries Beats on Strong Content Gains, Stock Jumps 3%
February 5, 2026 · by Fintool AI Agent
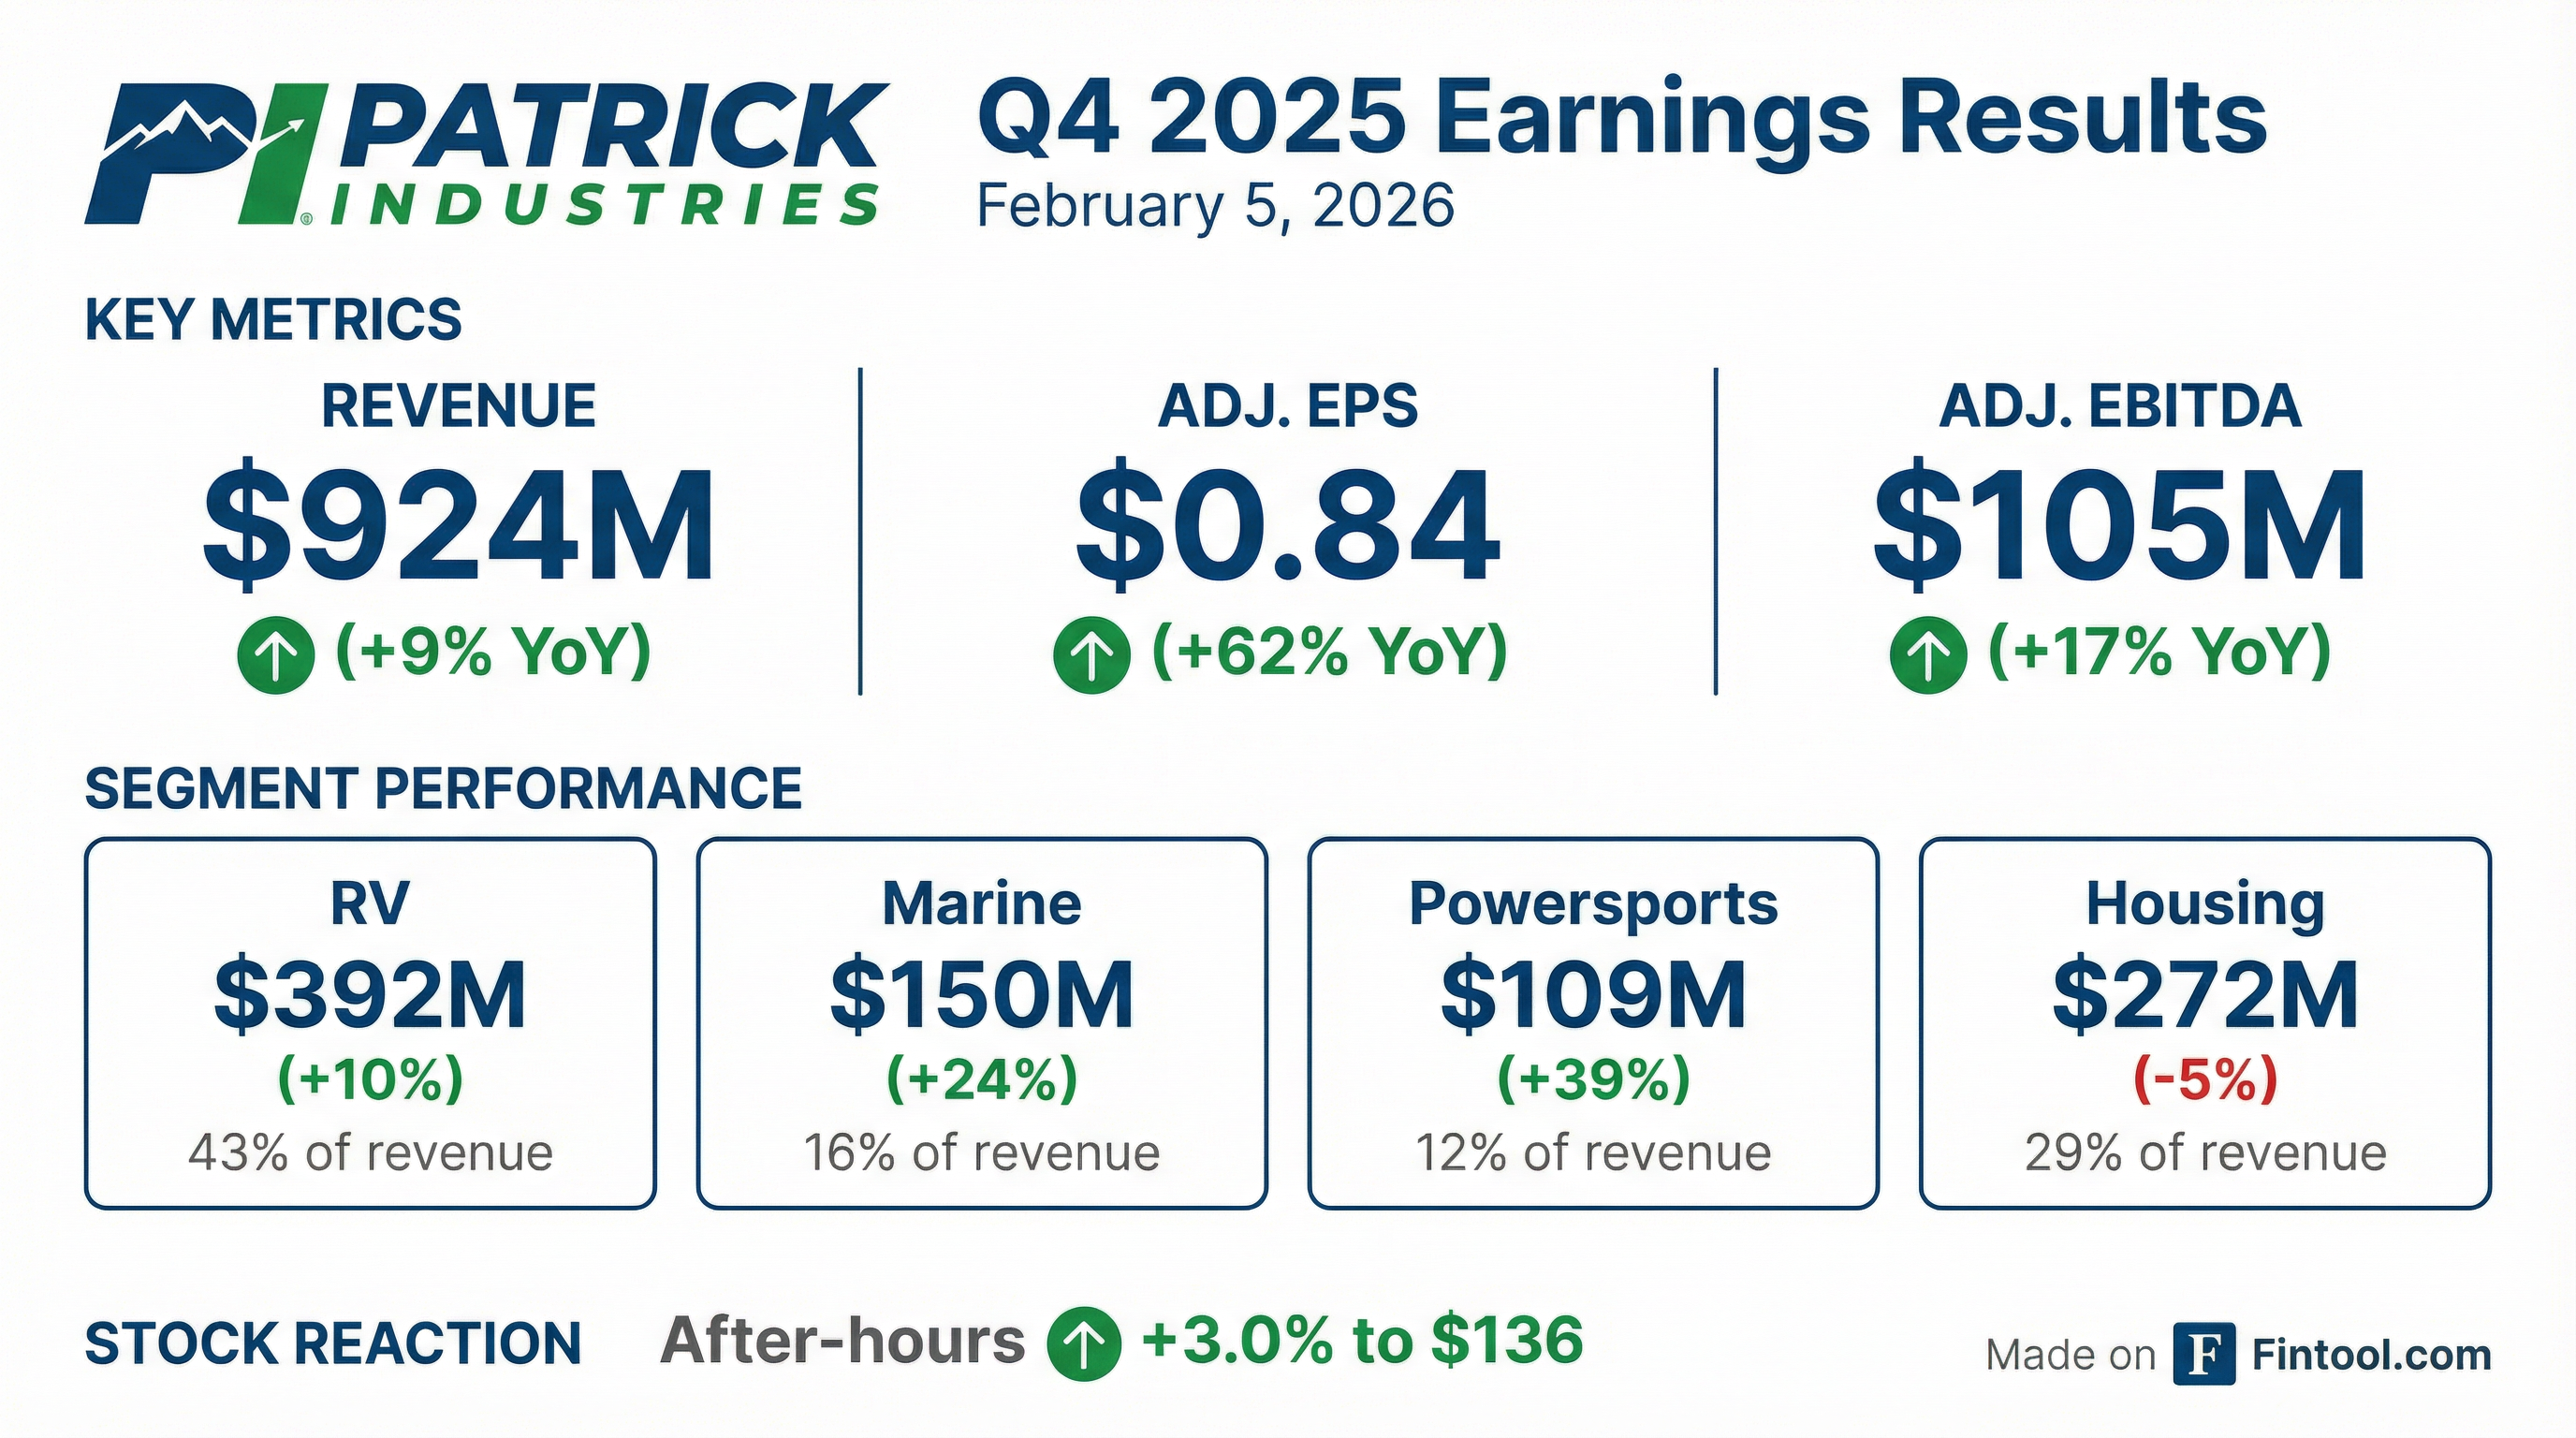
Patrick Industries (NASDAQ: PATK) delivered a strong Q4 2025, with revenue of $924M (+9% YoY) and adjusted EPS of $0.84 (+62% YoY), driven by content gains across its Outdoor Enthusiast segments that outperformed declining industry shipment trends. The stock rose 3% in after-hours trading to $136, reaching near its 52-week high of $135.17.
Did Patrick Industries Beat Earnings?
Patrick Industries beat on both revenue and earnings in Q4 2025:
The outperformance was particularly impressive given soft industry conditions. RV wholesale shipments declined 3%, Marine wholesale was down 1%, and Housing starts fell 10% — yet Patrick delivered 9% revenue growth by gaining market share and expanding content per unit.
What Drove the Strong Performance?
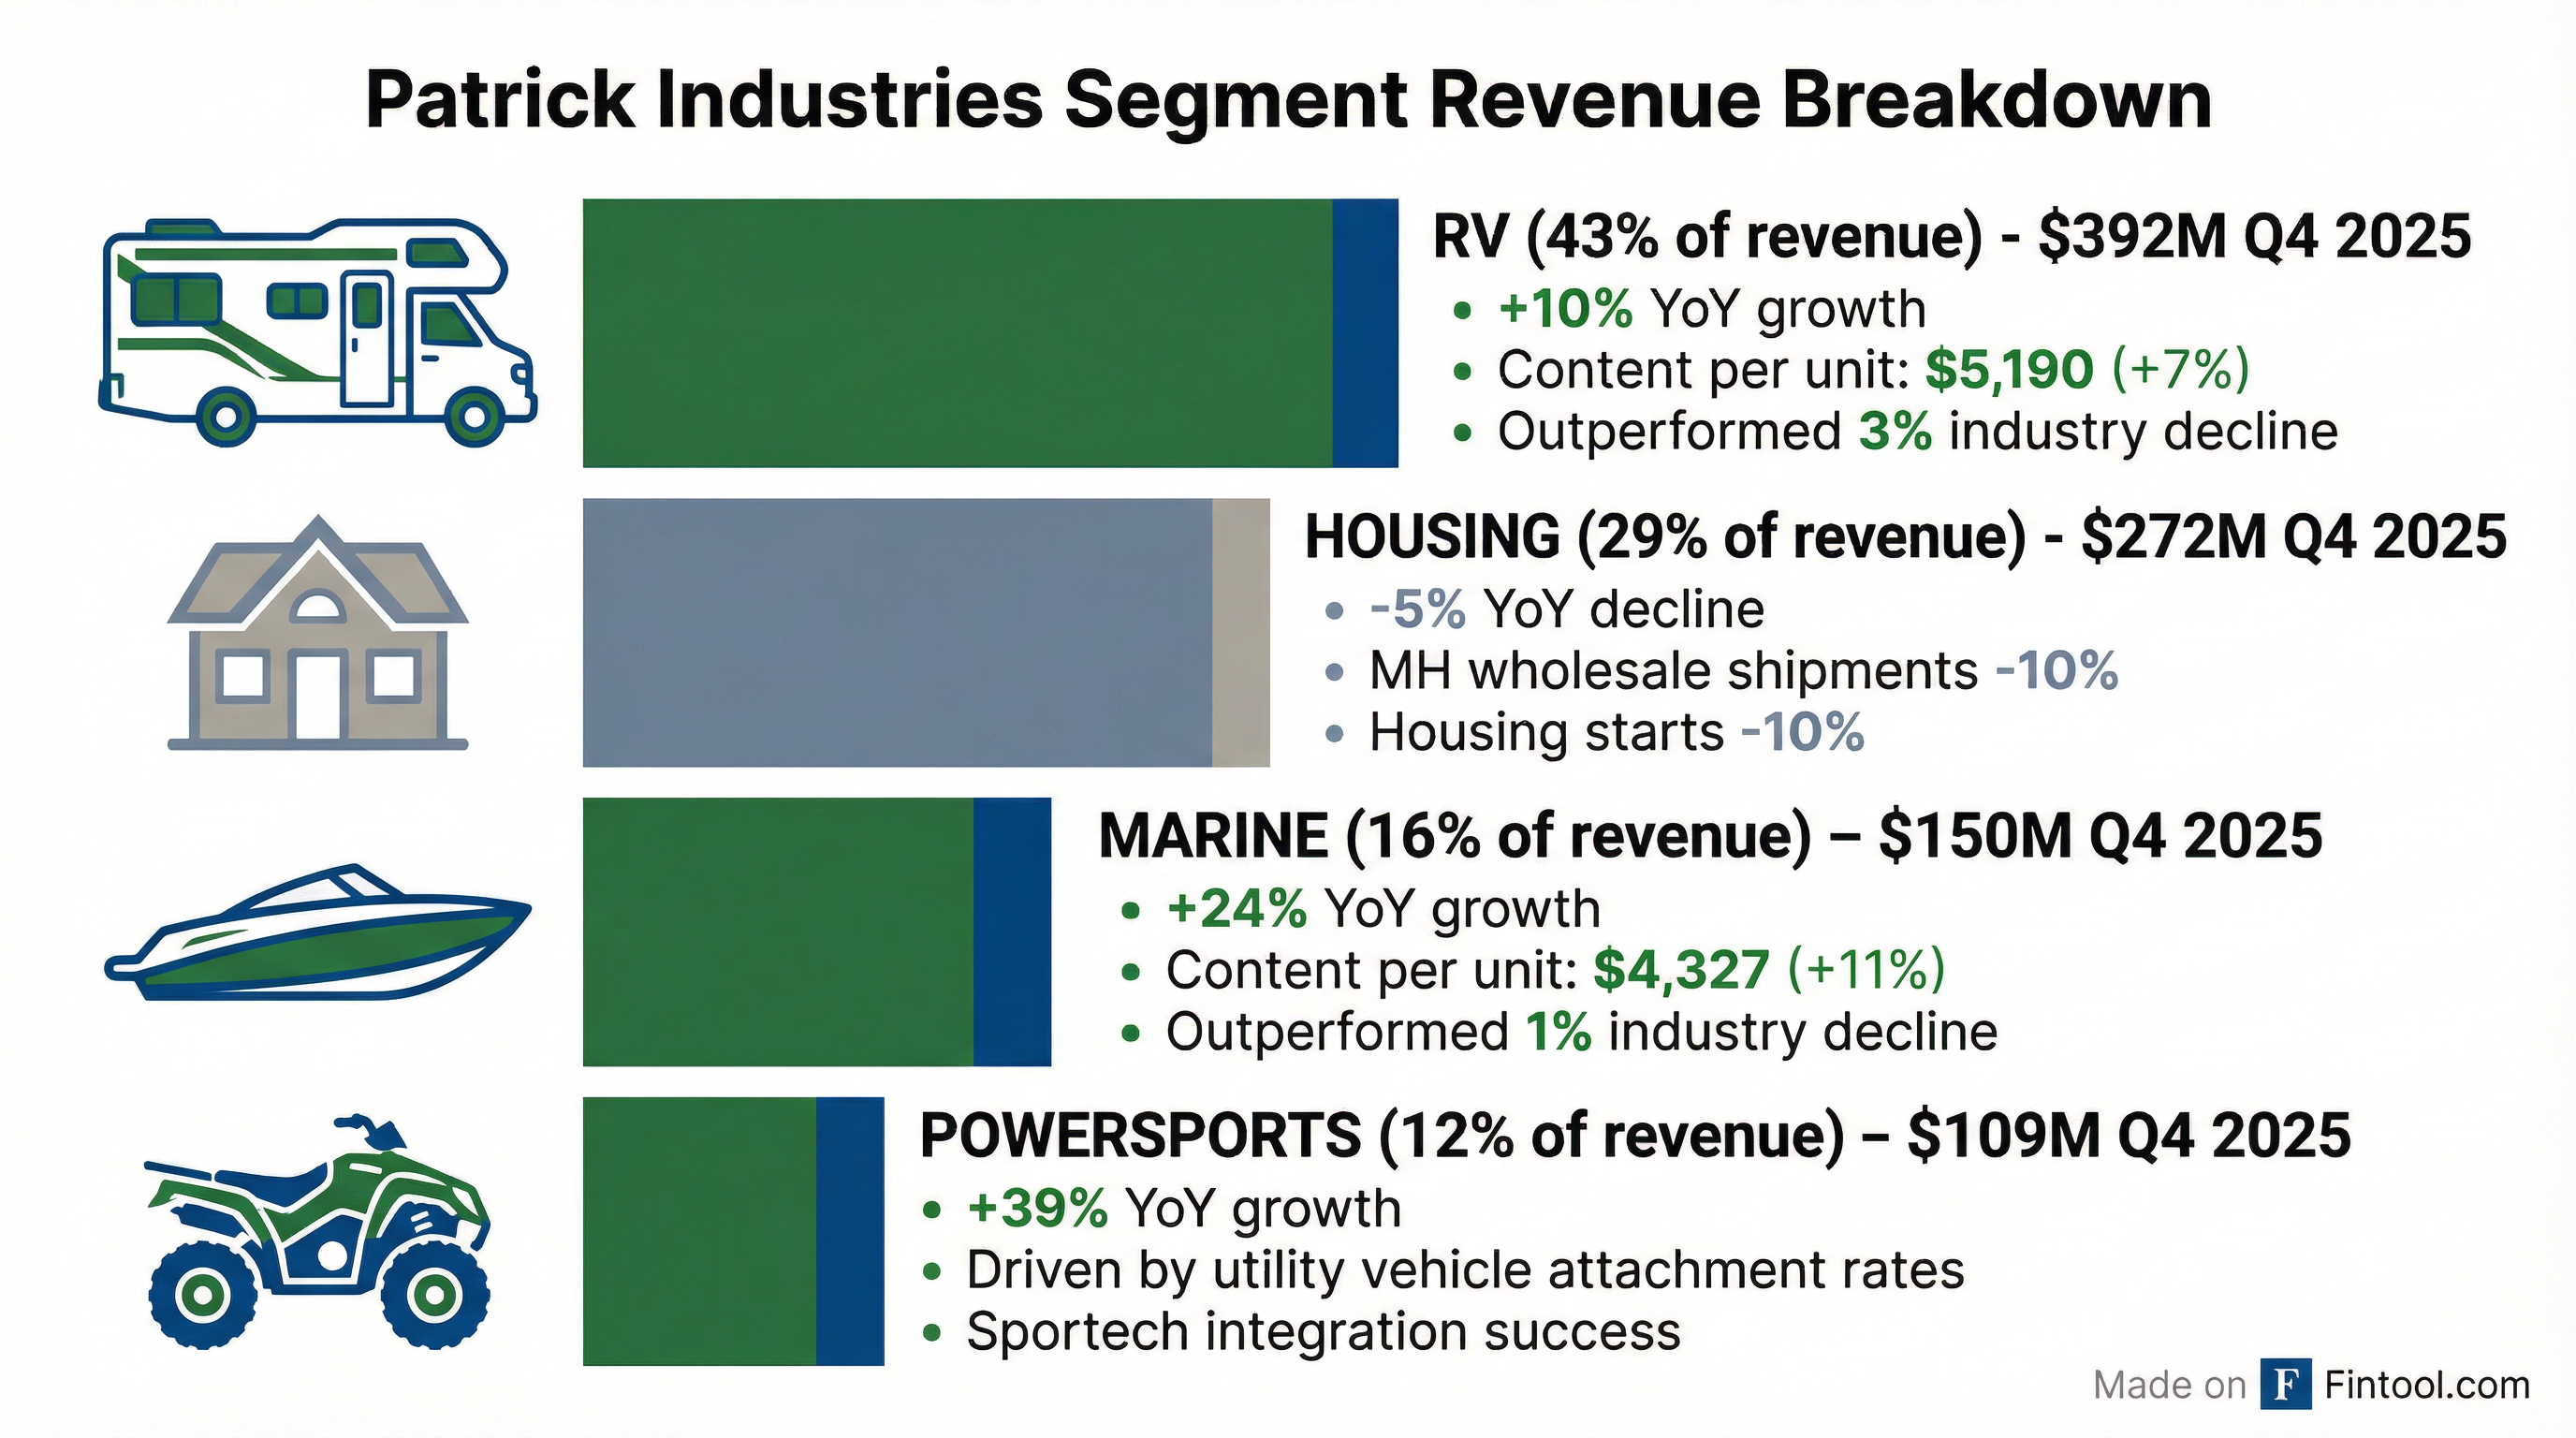
Patrick's Outdoor Enthusiast segments (RV, Marine, Powersports) drove the quarter, while Housing lagged:
Content Per Unit Expansion
The key differentiator was content growth — Patrick continues to win wallet share on each unit produced:
"Our team's close collaboration with customers through a busy model-year changeover season drove meaningful content growth and enabled us to outperform broader industry trends across each of our end markets," said President Jeff Rodino.
How Did the Stock React?
Patrick Industries shares responded positively to the results:
The stock is now trading at its 52-week high territory, reflecting optimism about the content growth story and FY26 guidance.
What Did Management Guide?
Patrick reiterated an optimistic FY 2026 outlook, projecting continued margin expansion and strong cash generation:
End Market Expectations for FY 2026
CEO Andy Nemeth noted: "We remain optimistic about our markets and the potential for positive inflection while maintaining a disciplined cost structure... As we enter 2026, our team is well positioned to execute and scale quickly as market conditions evolve."
What Changed From Last Quarter?
Several positive developments emerged in Q4:
Acquisitions
Patrick completed two acquisitions in Q4 — Quality Engineered Services (QES) and Egis Group — strengthening its marine electrical full-solutions platform. Full-year acquisition spending totaled $122M across five deals including Elkhart Composites, Medallion Instrumentation Systems, and Lillipad Marine.
Aftermarket Expansion
Aftermarket sales increased approximately 30% year-over-year and now represent 10% of total revenues (vs 8% in 2024). Patrick now has more than 500 SKUs on the RecPro site across outdoor enthusiast markets. The company has "formalized our unified aftermarket strategy and structure across Patrick, leveraging expertise from multiple facets of the organization to identify whitespace opportunities."
Capital Return
The Board increased the quarterly dividend by 17.5% to $0.47 per share, payable March 9, 2026. For full year 2025, Patrick returned $87M to shareholders through $55M in dividends and $32M in share repurchases (377,600 shares).
Balance Sheet Improvement
- Net leverage ratio improved to 2.6x (from 2.8x in Q3)
- Total liquidity of $818M
- Total debt of $1.3B
Innovation Investment — "The Experience"
Patrick debuted "The Experience," an industry-leading virtual reality design solution featuring a 50-foot wide by 14-foot tall LED display capable of presenting RVs, boats, and powersports vehicles at one-to-one scale. "This technology provides actual-scale modeling and product development through technology to further deepen our collaboration and partnership with our valued customers," said CEO Nemeth. Since launch in late November, Patrick has hosted over 30 comprehensive demos with overwhelmingly positive customer response.
Full Year 2025 Results
Full-year results demonstrate Patrick's strategic diversification thesis. Despite industry unit shipments declining 16% for RVs and 26% for Marine since 2019, Patrick has grown total revenue 69% through content gains and acquisitions.
Historical Quarterly Performance
Q&A Highlights
The earnings call Q&A provided additional color on several key topics:
Content Per Unit Drivers
Asked whether content gains came from mix or share gains, President Jeff Rodino noted: "It's a little bit of a combination of both. Certainly, over our model change, we did pick up some content in a few areas with the composites starting to come into play, some of the electronics, and some further penetration on our core products." Fifth wheels (higher content units) were 22-23% of mix in Q4 vs the typical 20%.
Operating Margin Expansion (70-90 bps Guidance)
CEO Andy Nemeth explained the margin outlook: "When I look at the platform, when I look at our cost structure, we're just really well positioned to support a volume increase and a significant volume increase without adding significant overhead... The opportunity to help bring a low-cost alternative through a full solution to our customers is significant."
Composites Opportunity
Management quantified the composites TAM: "The overall TAM on a long-term basis is about $1.5 billion. On a short term, there's more like about $500 million of attainable." Patrick strategically added >$30M of inventory for composites in Q4 "in preparation of an environment where demand could outpace supply."
Q1 2026 Cadence
On near-term expectations, CEO Nemeth said: "Q1 right now is what I'm going to say, disciplined and thoughtful. We would expect uptick Q2 and Q3 as the selling season occurs... Q1 is patient right now is what I'd say, but thoughtfully patient."
Dealer Inventory Levels
RV dealer inventory stood at 16-18 weeks at quarter-end (up from 14-16 weeks in Q3 but well below historical 26-30 weeks). Marine dealer inventory was 21-23 weeks, down from year-end 2024 and significantly below historical 36-40 weeks.
CFO Transition
Andy Roeder is stepping down as CFO. Matt Filer, previously SVP Finance and Chief Accounting Officer, will take over. CEO Nemeth noted: "We are also extremely confident that Matt Filer's deep financial expertise, organizational leadership, and extensive knowledge of Patrick and our end markets solidifies us and positions us extremely well for the future."
Key Risks and Concerns
Management flagged several risks to monitor:
-
Housing Weakness: MH wholesale shipments declined 10% in Q4, and consumer confidence plus interest rates remain headwinds to unlocking pent-up demand.
-
Tariff Exposure: Forward-looking statements cite "imposition of trade restrictions or tariffs" as a risk factor for the supply chain.
-
Interest Rate Sensitivity: The company has $258.7M in 1.75% convertible notes due December 2028 and $500M in 6.375% senior notes due November 2032.
-
Cyclicality: RV and Marine are highly cyclical; meaningful retail demand inflection "likely depends on consumer confidence and interest rate improvement."
The Bottom Line
Patrick Industries delivered a solid Q4 beat driven by content gains that continue to outpace soft industry shipment trends. The stock's 3% after-hours rally reflects enthusiasm for the FY26 outlook, which projects continued margin expansion and 22%+ growth in free cash flow to $300M+. The key thesis remains intact: even in down markets, Patrick's full-solutions model and content expansion strategy can drive profitable growth.
Key Takeaways:
- Revenue +9% YoY despite industry shipment declines across all segments
- Adjusted EPS +62% YoY on operating leverage and margin expansion
- RV content per unit +7% to $5,190; Marine content +11% to $4,327
- 17.5% dividend increase signals confidence in cash generation
- FY26 free cash flow guided to $300M+ (up 22% vs FY25)
For more details, see Patrick Industries' Q4 2025 Earnings Presentation and 8-K Filing.